
Understand the Brief
Clarify audience, purpose, source material, channel and required visual format.
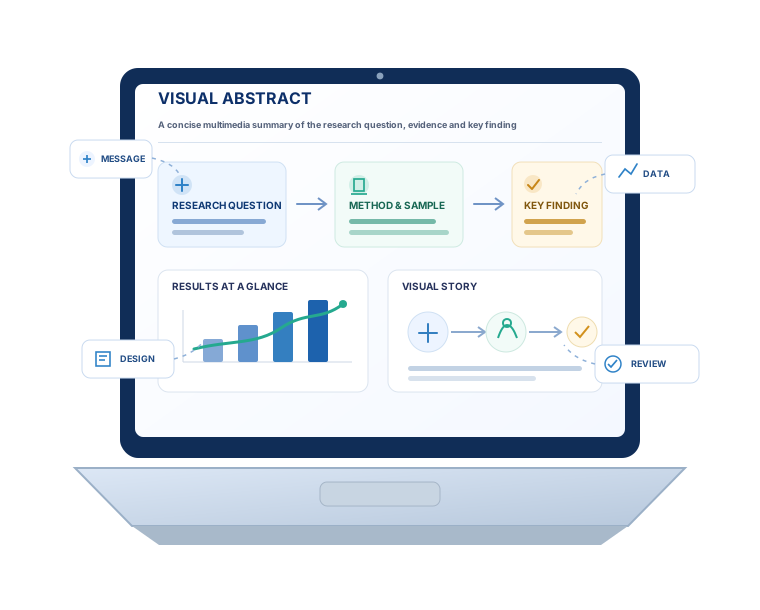
Turn dense research, complex findings and technical information into a structured visual abstract that communicates the study question, method, evidence and key message with clarity. The service combines research-focused content shaping, scientific visual communication and audience-ready design.
A research-first workflow that moves from understanding the source material to structured visual communication, review and audience-ready delivery.
Clarify audience, purpose, source material, channel and required visual format.
Identify the study question, method, results, relationships and essential messages.
Set the information hierarchy, narrative sequence and visual emphasis before design begins.
Combine concise text, diagrams, figures and data visualization into one coherent composition.
Align layout and dimensions to the intended publication, presentation or digital context.
Check readability, scientific labels, visible values, consistency and handoff requirements.
Each part of the service is designed around one goal: make the research easier to understand without separating the visual story from the underlying evidence.
Distil the core question, context, result and conclusion from the supplied research source.
Condense long research text into short, accurate labels, headings, callouts and takeaway statements.
Build a clear composition using diagrams, iconography, scientific illustrations and information hierarchy.
Use supplied charts, figures and quantitative results to communicate evidence visually and consistently.
Prepare the visual story for journal, conference, presentation, website and social communication contexts.
Review visible terminology, labels, hierarchy, contrast, legibility and consistency before final handoff.
Tools referenced in the service design: Tableau • Power BI • Illustrator • InDesign • Canva Pro • Figma • WordPress • Google Analytics • Mailchimp • and more
The core deliverable is the visual abstract itself. Supporting formats can be scoped around how and where the research will be communicated.
The same research can require different levels of explanation depending on the audience. Visual abstracts provide a compact structure that can support both specialist and broader communication.
Summarise papers, studies and findings for publication, presentations and collaboration.
Explain methods, outcomes and evidence through a structured scientific visual story.
Translate evidence into accessible visuals for policy discussions and stakeholder engagement.
Support proposals and progress communication with clear visual summaries of research purpose and value.
Make complex evidence easier for non-specialist audiences to scan, understand and discuss.
Communicate research, sustainability and innovation insights in a concise visual format.
A fixed turnaround is not stated on this page. Scheduling is confirmed after reviewing the source material, visual complexity, output formats and review requirements.
“Their ability to translate our research into compelling stories and measurable impact has been transformative.”— Head of Research, Global Institute
Practical questions about source material, scientific accuracy, formats and scope for a multimedia research content visual abstract.
It is a concise visual communication asset that turns the key elements of research into a structured combination of short text, data, diagrams, figures and visual cues so the main message can be understood quickly.
Provide the latest manuscript, report, study summary or research notes together with any figures, tables, data, brand guidance, journal instructions and required output dimensions that should shape the visual abstract.
Yes. A journal manuscript can be used as the core source when the brief identifies the intended audience, the key message to emphasise and any journal-specific requirements.
Existing figures, tables and charts can be incorporated or visually simplified when they are supplied and appropriate for the intended visual abstract.
The design should communicate the supplied research accurately and should not introduce new scientific claims. Final factual responsibility remains with the author or research team reviewing the visual content.
Yes. When journal or publisher guidelines are supplied they can be used to shape dimensions, typography, labelling, visual hierarchy and other presentation requirements.
The project brief can include channel-specific versions for publication, websites, presentations, conferences or social media, with each format adapted to the required dimensions and reading context.
Not necessarily. Source text can be condensed into concise visual-abstract copy, but the research team should review all scientific wording, values, labels and conclusions before final approval.
The workflow starts from supplied source material, identifies the evidence and message hierarchy, and then checks visible labels, numbers, figure references and key statements against the approved research content during review.
The visual abstract service focuses on communication and presentation. New statistical conclusions or unsupported interpretations should not be introduced; the underlying research findings and data should be supplied by the client.
If editable design files are required, include that requirement in the project brief so the expected handoff format can be agreed before work begins.
This page does not state a fixed turnaround. Scheduling should be confirmed after the source material, visual complexity, number of formats and review requirements are understood.
Share your manuscript, study summary, figures, journal guidance and communication goals so the visual abstract can be scoped around your actual research and audience.
Discuss Your Requirement