Information Hierarchy
Clear section, page, and content structure

Turn complex information into polished reports and professional documents with stronger visual hierarchy, consistent branding, readable layouts, clear charts and tables, and production-ready presentation across every page.
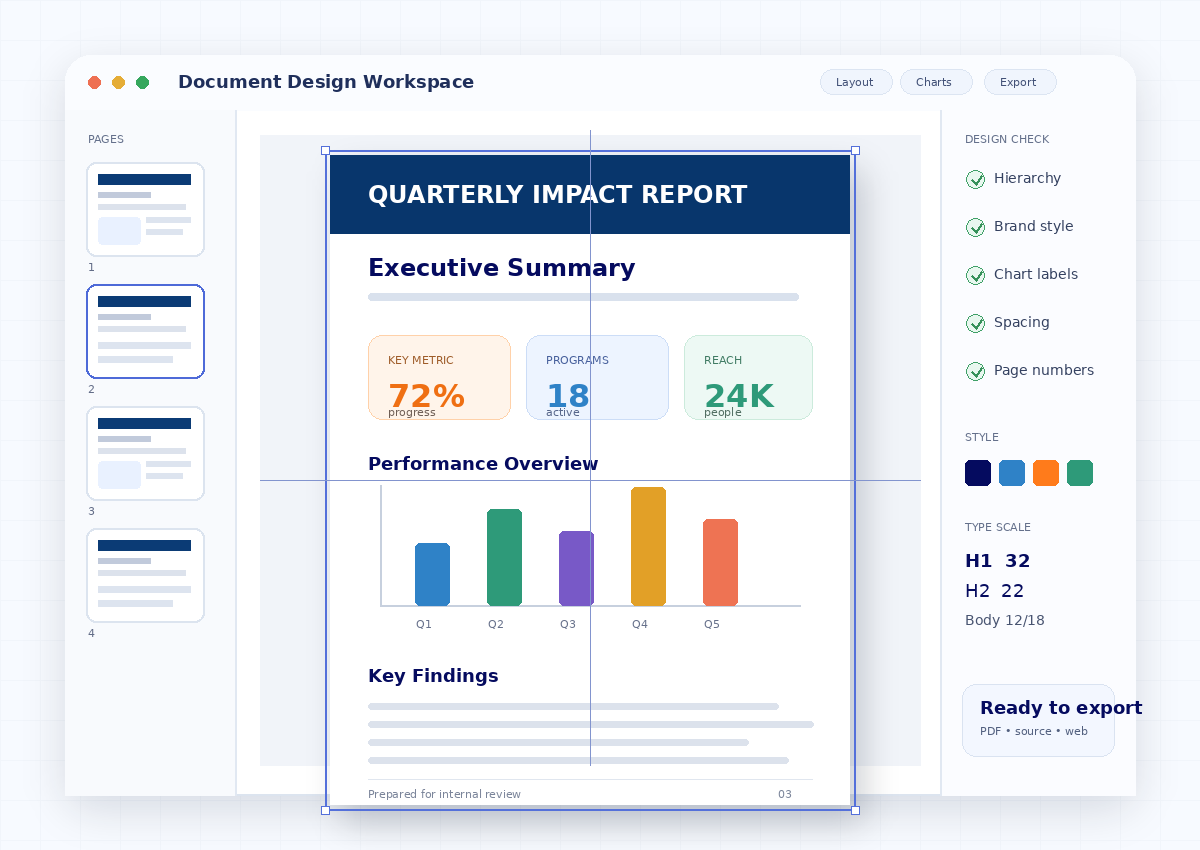
Clear section, page, and content structure
Colours, type, imagery, and layout aligned
Readable charts, tables, and visual summaries
Outputs prepared to the agreed specification
Project files treated as service information
A report can contain valuable research, analysis, or business information and still be difficult to use when the visual system does not support the content.
Important ideas compete visually because headings, summaries, callouts, and supporting details do not have clear levels.
Long paragraphs, weak spacing, and limited visual signposting can make otherwise useful content feel heavy and difficult to scan.
Fonts, colours, graphic elements, and page styles vary between sections, reducing visual cohesion and professional polish.
Data may be correct but still difficult to interpret when labels, scales, colour, spacing, and emphasis are not handled clearly.
Page breaks, image quality, inconsistent margins, missing page elements, or export settings can weaken an otherwise strong document.
Organise sections, page flow, summaries, and supporting content into a clearer reading structure.
Build consistent grids, margins, spacing, page systems, and reusable layouts for long documents.
Create readable heading, body, caption, callout, list, and reference styles with clear hierarchy.
Apply supplied brand colours, logos, fonts, graphic devices, and style rules consistently.
Style data visuals to improve comparison, emphasis, labeling, legibility, and document consistency.
Improve dense tables with clearer alignment, spacing, headers, hierarchy, and visual grouping.
Balance photos, diagrams, figures, captions, callouts, and whitespace across the page.
Create reusable masters, page types, style rules, and recurring components for future editions.
Check page consistency and prepare the agreed final output for digital, print, or editable use.
The workflow moves from content and design requirements through structure, visual system, page production, review, and final handoff.
Example framework for showing how design priorities can be reviewed before full production.
| Criteria | Weight | This Opportunity Score | Weighted Score | Notes |
|---|---|---|---|---|
| Information Hierarchy | 20% | 5 | 1.00 | Strong section logic |
| Brand Alignment | 15% | 4 | 0.60 | Core brand assets available |
| Readability | 20% | 4 | 0.80 | Dense sections need spacing |
| Data Visualization | 15% | 4 | 0.60 | Charts can be standardized |
| Visual Consistency | 15% | 4 | 0.60 | Page system needs tightening |
| Production Readiness | 15% | 4 | 0.60 | Final export checks required |
| Total | 100% | 4.20 / 5.00 | Illustrative strong design fit |
Illustrative example showing the visual difference between content that is merely placed on a page and content that is deliberately structured for reading and presentation.
Build a complete visual system when the organization does not already have a mature report template.
Standardize recurring reports and documents with reusable page structures and visual rules.
Improve clarity, hierarchy, and professional presentation for high-visibility documents.
Final deliverables depend on the confirmed scope. The items below show common output types for report and document design projects.
Complete page design with the approved visual system applied across the agreed content.
PDF / OUTPUTSource-file delivery can be included when the working application and editable format are agreed in scope.
SOURCEConsistent typography, colour, spacing, page rules, and recurring component treatments.
STYLE GUIDEData visuals formatted to match the document and improve comparison, labeling, and readability.
VISUALSMaster layouts or recurring page types can be prepared when repeat use is part of the requirement.
TEMPLATEDesign decisions or required client actions can be surfaced during review where clarification is needed.
NOTESFinal production can be prepared for digital PDF, print-ready use, or both when specifications are supplied.
EXPORTA final cross-check of agreed page, layout, consistency, and output requirements before handoff.
QAThe value is not decoration. It is a repeatable visual system that helps content, data, brand rules, and production requirements work together.
A layered review keeps structure, visual design, data presentation, consistency, and final production aligned.
Sections, page types, density, and priority information.
Typography, colour, grid, spacing, imagery, and components.
Charts, tables, figures, captions, and callouts.
Headings, labels, numbering, styles, and alignment.
Page completeness, export quality, and agreed delivery requirements.
Fixed turnaround has not been assumed. The delivery date is confirmed after page count, content readiness, complexity, reviews, and output formats are known.
For projects that can move through normal design, review, and refinement stages.
Closer deadlines can be discussed after scope, readiness, and current availability are assessed.
Share the fixed delivery date first so design depth and review cadence can be planned realistically.
Pricing is based on the actual scope and complexity of the document. Share your source file and requirements so the design effort can be assessed without inventing a generic package price.
Unpublished reports, internal documents, instructions, and project data are treated as service information within the designated workflow.
Working files, brand assets, data files, images, and supporting documents are used to complete the agreed design requirement.
Feedback can be consolidated around defined page, layout, chart, table, and production issues instead of fragmented visual changes.
Only the formats confirmed for the project are prepared for delivery, reducing ambiguity around editable, print, and digital outputs.
Internal or unpublished material is not presented here as a public example or endorsement.
The service can include information hierarchy, page layout, typography, brand styling, tables, charts, infographics, image placement, page systems, template development, and final production preparation according to the agreed scope.
Suitable projects can include annual and impact reports, research reports, business reports, white papers, ESG or CSR documents, policy briefs, proposals, case studies, company profiles, manuals, and other structured professional documents.
Yes. If the content is already approved, the project can focus on hierarchy, layout, typography, brand application, charts, tables, visual consistency, and production quality without changing the underlying meaning.
Yes. Supply the available logo files, colour specifications, typography guidance, templates, and brand rules so the document system can be aligned with them.
The design scope can include chart styling, table formatting, visual summaries, and infographic-style presentation when the source data and required context are supplied.
Editable source-file delivery can be included when it is part of the confirmed project scope. The exact application and output formats should be agreed before production begins.
Yes. A project can focus on a reusable visual system, master pages, recurring layouts, styles, tables, chart treatments, and template rules instead of a one-off final document.
Pricing is scoped after reviewing factors such as page count, source-file condition, number of unique layouts, data-visualization requirements, brand-guideline complexity, image or illustration needs, editable-source requirements, and deadline constraints.
A delivery date is confirmed after the document length, content readiness, design complexity, review rounds, output formats, and deadline requirements have been assessed.
Provide the latest content file, brand assets, preferred examples or visual references, charts or data files, image assets, required dimensions or output specifications, and any fixed deadline or review requirements.
The final production scope can be set up for digital PDF, print-ready output, or both, depending on the specifications confirmed for the project.
Project files, instructions, internal data, and unpublished content should be handled as confidential service information through the designated submission, review, and delivery process.
Share your current document, page count, design goals, brand requirements, data-visualization needs, output formats, and deadline. The scope can then be assessed without assuming a generic price or turnaround.
Tell us the document type, approximate page count, current file format, and whether the content is final or still changing.
Share logos, colours, brand guidelines, existing templates, and any preferred visual references.
Identify how many charts, tables, maps, diagrams, or infographic-style visuals need to be designed.
Specify digital PDF, print-ready output, editable source requirements, dimensions, and any fixed delivery date.
Provide enough detail to review page count, design complexity, brand requirements, visual assets, required formats, and deadline feasibility.