Unclear Chart Purpose
The visual does not answer a specific research question or support a clear point.

Turn complex financial data, valuation assumptions, peer comparisons and forecast scenarios into clear, report-ready charts, tables and exhibits that support the visual logic of your investment research.
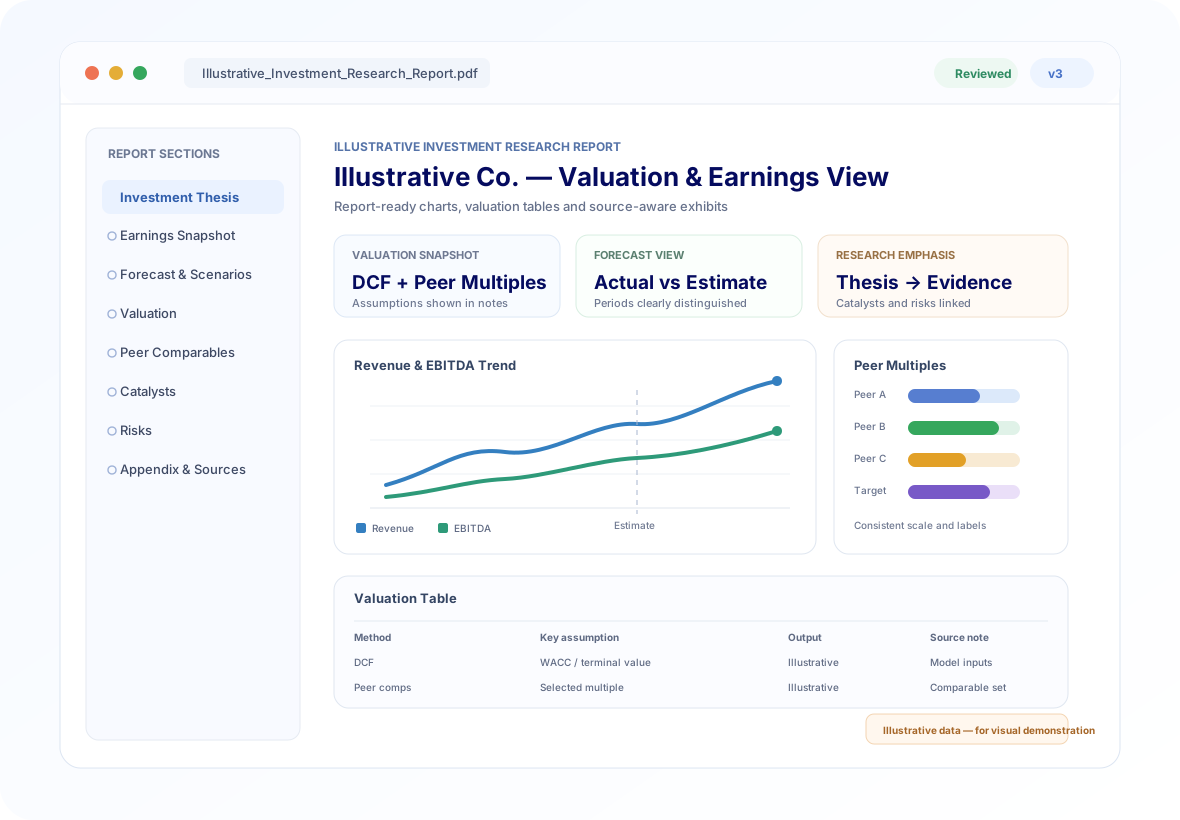
The price is set per small exhibit set rather than per report so customers can buy a meaningful data-visualisation deliverable without committing to a full research-report redesign.
Suitable for: Analysts and research teams with approved data who need selected financial or investment exhibits turned into clearer, publication-ready visuals.
New data analysis, more than five exhibits, custom illustration, interactive graphics, or complex valuation dashboards are priced separately.
Research can be analytically sound but still difficult to scan when charts, tables, assumptions and source notes do not work together. The service focuses on the presentation issues that make investment reports harder to interpret.
We identify where the report's exhibits are unclear, inconsistent or disconnected from the analytical story.
The visual does not answer a specific research question or support a clear point.
Currency, percentages, periods or axes change in ways that make comparisons difficult.
Default chart formatting is carried into the report without enough hierarchy or annotation.
Valuation assumptions, outputs and sensitivities are shown without a coherent visual sequence.
Too many series, labels or competing elements reduce readability and emphasis.
Charts lack the notes readers need to understand inputs, estimates or methodology.
Colours, typography, legends and table treatment do not follow one consistent system.
A complete visualization workflow can move from report purpose and source-data review through chart development, valuation exhibits, annotation, consistency checks and final report-ready output.
The objective is not decoration. It is to move from raw or inconsistent exhibits to a structured visual system in which charts, tables, annotations and assumptions are easier to follow.
The service goes beyond making a chart look cleaner. It considers the research question, financial context, comparison logic, assumptions, source notes and consistency of the full report's visual system.
| Support Dimension | Simple Chart Formatting | Generic Data Visualization | Investment Research Visualization Support |
|---|---|---|---|
| Report purpose & audience review | × | Partial | ✓ |
| Source-data and exhibit audit | × | Partial | ✓ |
| Financial KPI selection & hierarchy | × | Partial | ✓ |
| Valuation exhibit structure | × | × | ✓ |
| Peer-comparison design | Basic | ✓ | ✓ |
| Actual / estimate / scenario distinction | Basic | ✓ | ✓ |
| Catalyst & risk visual treatment | × | Partial | ✓ |
| Source notes & assumption callouts | × | Partial | ✓ |
| Full report visual consistency | Basic | ✓ | ✓ |
| Reviewer-focused refinement | × | × | ✓ |
| Best for | Cosmetic cleanup | General visual communication | Complete investment-research report visualization |
Visualization can be adapted to different investment-research formats when the underlying analysis, data and report requirements are supplied.
Company performance, valuation, estimates, catalysts and risks.
Structured visual support for a comprehensive company research narrative.
Actual-versus-estimate charts, KPI movements and period comparisons.
DCF, multiples, sensitivities and valuation-bridge presentation.
Comparable metrics, rankings, relative trends and benchmark views.
Base, upside, downside and assumption-driven visual comparisons.
Market sizing, growth trends, segmentation and competitive exhibits.
Concise charts and tables supporting a decision-oriented document.
The workflow starts with the report's purpose and source files, then moves through visual planning, development, consistency review and final delivery.
Share the report, model outputs, data files, existing charts and deadline.
Confirm the exhibit list, audience, format and visual priorities.
Connect each exhibit to its underlying data and required notes.
Define chart types, hierarchy, scales, colour logic and layout.
Build and refine the agreed research exhibits.
Review labels, units, periods, assumptions and comparative logic.
Align titles, notes, sources, typography and report conventions.
Provide the agreed report-ready and supporting visualization files.
A clear source package helps the visualization work stay aligned to the analysis. Final deliverables are confirmed during scoping so the handoff matches your report workflow.
A multi-stage review checks that the visuals are consistent with the supplied source data, analytical context and report-format requirements before final handoff.
Check file structure, exhibit purpose and source references.
Review periods, currency, percentages, labels and units.
Verify chart type, scale, series and comparison clarity.
Check that visual outputs reflect supplied assumptions and labels.
Review titles, sources, notes, typography and style consistency.
Review the final handoff for completeness and report usability.
The visualization approach can be adapted across common investment-research contexts. Client files and unpublished analytical material should be handled as sensitive project information.
Share any internal confidentiality, compliance or file-retention requirements before work begins so the project process can be aligned accordingly.
The published starting price above covers the defined entry scope for Investment Research Data Visualization. Larger, deeper, or faster-turnaround requirements are quoted after the actual materials and deliverables are reviewed. Scope, complexity, source files and deadline are reviewed before a quote and timeline are confirmed.
These questions cover scope, data inputs, valuation visuals, chart redesign, source notes, delivery and project quoting for the Investment Research Report Data Visualization Service.
It focuses on turning financial, valuation, market, peer-comparison and forecast data into clear charts, tables and report-ready exhibits. The exact scope is confirmed from your report draft, source files, audience and required output.
Yes. Spreadsheet or tabular source files are useful for building and checking visualization inputs. You can also provide an existing report draft, model outputs, source notes and any house-style guidance that should be followed.
Yes. Existing charts can be reviewed for purpose, hierarchy, scale, units, labels, colour use, comparability, source notes and consistency with the surrounding research narrative.
The service can cover valuation exhibits, peer-comparison tables and charts, scenario views and other research visuals when the underlying data, assumptions and required methodology are supplied.
Yes. Actual, estimated and scenario periods can be visually distinguished so readers can understand what is historical, forecast or assumption-driven.
Visualization work is designed to clarify the presentation of the research you provide. Changes to investment conclusions, model assumptions or analytical judgments should remain under the client's control unless a separate analytical scope is explicitly agreed.
Yes. Share the current research-report template, typography, colour guidance, chart conventions and any compliance or publication requirements that should be reflected in the visual system.
Where source information and assumptions are provided, they can be incorporated into chart notes, table notes, legends and exhibit labels so the finished visuals remain understandable in context.
Send the report draft or outline, the relevant data/model outputs, any existing charts, the desired number or type of exhibits, your template or brand guide if applicable, and your target deadline.
Delivery timing depends on the amount and condition of source data, number of exhibits, chart complexity, report length, formatting requirements and deadline. The exact timing is confirmed after scope review.
The published starting price above covers the defined entry scope for Investment Research Data Visualization. Larger, deeper, or faster-turnaround requirements are quoted after the actual materials and deliverables are reviewed. A custom quote is prepared after reviewing the scope, source files, number of visuals, complexity, formatting requirements and requested turnaround.
The final handoff is agreed during scoping and can include report-ready charts and tables together with the supporting editable or source-format files that are part of the confirmed project scope.
Share your report type, source files, approximate number of visuals, deadline and any template or formatting requirements. The project can then be scoped around the actual research and deliverables.
The clearer the starting package, the easier it is to estimate the visual-development effort and identify which exhibits need the most attention.
Share the draft report, Excel/CSV data, model outputs and any existing exhibits.
Indicate the approximate number and type of charts, tables or valuation exhibits required.
Provide house style, brand guidance, publication requirements or sample report pages where applicable.
Share the target delivery date, time zone and any milestone that affects sequencing.
Provide enough detail for the source files, visualization complexity, expected outputs and deadline to be reviewed.
Share your report, source data and visualization requirements so the work can be scoped around the financial analysis, valuation exhibits and report format you actually need.
Separate historical and forecast periods.